Prometheus : Monitoring & TSDB
Prometheus Operator The Operator acts on the following custom resource definitions (CRDs):
Prometheus , which defines a desired Prometheus deployment. # 定义Prometheus集群Alertmanager , which defines a desired Alertmanager deployment. # 定义Alertmanager集群ThanosRuler , which defines a desired Thanos Ruler deployment.ServiceMonitor , which declaratively specifies how groups of Kubernetes services should be monitored. The Operator automatically generates Prometheus scrape configuration based on the current state of the objects in the API server. # 定义监控项PodMonitor , which declaratively specifies how group of pods should be monitored. The Operator automatically generates Prometheus scrape configuration based on the current state of the objects in the API server.Probe , which declaratively specifies how groups of ingresses or static targets should be monitored. The Operator automatically generates Prometheus scrape configuration based on the definition.PrometheusRule , which defines a desired set of Prometheus alerting and/or recording rules. The Operator generates a rule file, which can be used by Prometheus instances. # 定义告警策略
Prometheus Operator vs. kube-prometheus vs. community helm chart
kube-prometheus Components included in this package:
The Prometheus Operator
Highly available Prometheus
Highly available Alertmanager
Prometheus node-exporter
Prometheus Adapter for Kubernetes Metrics APIs
kube-state-metrics
Grafana
The kube-prometheus stack includes a resource metrics API server, so the metrics-server addon is not necessary.
kube-prometheus方式部署监控方案 1 2 3 4 5 6 7 8 9 cd ~/k8sclone https://github.com/coreos/kube-prometheus.gitcd kube-prometheus's_quay.io_quay.mirrors.ustc.edu.cn_' manifests/*.yaml manifests/setup/*.yaml
暴露Ingress 1 2 3 4 5 6 7 8 9 10 11 12 13 14 15 16 17 18 19 20 21 22 23 24 25 26 27 28 29 30 31 32 33 apiVersion: networking.k8s.io/v1beta1 kind: Ingress metadata: name: monitoring-ingress namespace: monitoring annotations: nginx.ingress.kubernetes.io/rewrite-target: / nginx.ingress.kubernetes.io/load-balance: "ip_hash" nginx.ingress.kubernetes.io/upstream-hash-by: "$request_uri" spec: rules: - host: monitoring.boer.xyz http: paths: - path: / backend: serviceName: grafana servicePort: 3000 - host: prometheus.boer.xyz http: paths: - path: / backend: serviceName: prometheus-k8s servicePort: 9090 - host: alertmanager.boer.xyz http: paths: - path: / backend: serviceName: alertmanager-main servicePort: 9093
kube-prometheus自定义配置 cd ~/k8s/kube-prometheus
Grafana 数据持久化 1 2 3 4 5 6 7 8 9 10 11 12 13 14 15 16 17 18 19 20 21 22 23 volumes: - name: grafana-storage persistentVolumeClaim: claimName: grafana-storage-k8s --- apiVersion: v1 kind: PersistentVolumeClaim metadata: labels: app: grafana grafana: k8s name: grafana-storage-k8s namespace: monitoring spec: accessModes: - ReadWriteOnce resources: requests: storage: 2Gi storageClassName: openebs-hostpath
Prometheus自定义配置 1 2 3 4 5 6 7 8 9 10 11 12 13 retention: 72h externalUrl: http://prometheus.boer.xyz additionalScrapeConfigs: name: additional-scrape-configs key: prometheus-additional.yaml storage: volumeClaimTemplate: spec: storageClassName: openebs-hostpath resources: requests: storage: 5Gi
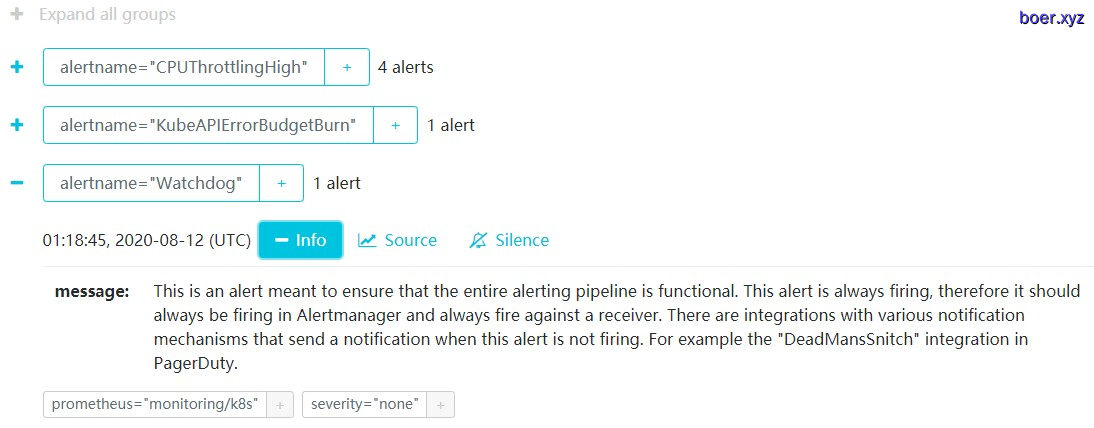
Alertmanager自定义配置 1 2 3 4 5 6 7 8 9 10 11 12 13 14 15 16 17 18 19 20 apiVersion: monitoring.coreos.com/v1 kind: Alertmanager metadata: labels: alertmanager: main name: main namespace: monitoring spec: image: quay.mirrors.ustc.edu.cn/prometheus/alertmanager:v0.20.0 nodeSelector: kubernetes.io/os: linux replicas: 1 securityContext: fsGroup: 2000 runAsNonRoot: true runAsUser: 1000 serviceAccountName: alertmanager-main version: v0.20.0 externalUrl: http://alertmanager.boer.xyz
Alertmanager企业微信告警 1 2 3 4 5 6 7 8 9 10 11 12 13 14 15 16 17 18 19 20 21 22 23 24 25 26 27 28 29 30 31 32 33 34 35 36 37 38 39 40 41 42 43 44 45 46 47 48 49 50 51 52 53 apiVersion: v1 kind: Secret type: Opaque metadata: name: alertmanager-main namespace: monitoring data: {}stringData: alertmanager.yaml: |- "global": "resolve_timeout": "5m" "inhibit_rules": - "equal": - "namespace" - "alertname" "source_match": "severity": "critical" "target_match_re": "severity": "warning|info" - "equal": - "namespace" - "alertname" "source_match": "severity": "warning" "target_match_re": "severity": "info" "receivers": - "name": "Default" "wechat_configs": # 企业微信接收告警信息 https://work.weixin.qq.com/api/doc/90000/90135/90236#%E6%96%87%E6%9C%AC%E6%B6%88%E6%81%AF - "corp_id": "<corp_id>" "to_user": "<user1|user2>" "agent_id": "<1000007>" "api_secret": "<api_secret>" - "name": "Watchdog" - "name": "Critical" "route": "group_by": - "alertname" # 按alertname分组告警 "group_interval": "5m" "group_wait": "30s" "receiver": "Default" "repeat_interval": "12h" # 重复告警间隔时间 "routes": - "match": "alertname": "Watchdog" "receiver": "Default" - "match": "severity": "critical" "receiver": "Default" kubectl delete -f alertmanager-main-secrets.yaml kubectl apply -f alertmanager-main-secrets.yaml
自动发现监控配置
https://github.com/prometheus-operator/prometheus-operator/blob/master/Documentation/additional-scrape-config.md
1 2 3 4 5 6 7 8 9 10 11 12 13 14 15 16 17 18 19 20 21 22 23 24 25 26 27 28 29 30 31 32 33 34 35 36 37 38 39 40 41 42 43 44 45 46 47 48 - job_name: 'kubernetes-endpoints' kubernetes_sd_configs: - role: endpoints relabel_configs: - source_labels: [__meta_kubernetes_service_annotation_prometheus_io_scrape ]action: keep regex: true - source_labels: [__meta_kubernetes_service_annotation_prometheus_io_scheme ]action: replace target_label: __scheme__ regex: (https?) - source_labels: [__meta_kubernetes_service_annotation_prometheus_io_path ]action: replace target_label: __metrics_path__ regex: (.+) - source_labels: [__address__ , __meta_kubernetes_service_annotation_prometheus_io_port ]action: replace target_label: __address__ regex: ([^:]+)(?::\d+)?;(\d+) replacement: $1:$2 - action: labelmap regex: __meta_kubernetes_service_label_(.+) - source_labels: [__meta_kubernetes_namespace ]action: replace target_label: kubernetes_namespace - source_labels: [__meta_kubernetes_service_name ]action: replace target_label: kubernetes_name - source_labels: [__meta_kubernetes_pod_name ]action: replace target_label: kubernetes_pod_name --- apiVersion: v1 kind: Secret metadata: name: additional-scrape-configs namespace: monitoring data: prometheus-additional.yaml: LSBqb2JfbmFtZTogJ2t1YmVybmV0ZXMtZW5kcG9pbnRzJwogIGt1YmVybmV0ZXNfc2RfY29uZmlnczoKICAtIHJvbGU6IGVuZHBvaW50cwogIHJlbGFiZWxfY29uZmlnczoKICAtIHNvdXJjZV9sYWJlbHM6IFtfX21ldGFfa3ViZXJuZXRlc19zZXJ2aWNlX2Fubm90YXRpb25fcHJvbWV0aGV1c19pb19zY3JhcGVdCiAgICBhY3Rpb246IGtlZXAKICAgIHJlZ2V4OiB0cnVlCiAgLSBzb3VyY2VfbGFiZWxzOiBbX19tZXRhX2t1YmVybmV0ZXNfc2VydmljZV9hbm5vdGF0aW9uX3Byb21ldGhldXNfaW9fc2NoZW1lXQogICAgYWN0aW9uOiByZXBsYWNlCiAgICB0YXJnZXRfbGFiZWw6IF9fc2NoZW1lX18KICAgIHJlZ2V4OiAoaHR0cHM/KQogIC0gc291cmNlX2xhYmVsczogW19fbWV0YV9rdWJlcm5ldGVzX3NlcnZpY2VfYW5ub3RhdGlvbl9wcm9tZXRoZXVzX2lvX3BhdGhdCiAgICBhY3Rpb246IHJlcGxhY2UKICAgIHRhcmdldF9sYWJlbDogX19tZXRyaWNzX3BhdGhfXwogICAgcmVnZXg6ICguKykKICAtIHNvdXJjZV9sYWJlbHM6IFtfX2FkZHJlc3NfXywgX19tZXRhX2t1YmVybmV0ZXNfc2VydmljZV9hbm5vdGF0aW9uX3Byb21ldGhldXNfaW9fcG9ydF0KICAgIGFjdGlvbjogcmVwbGFjZQogICAgdGFyZ2V0X2xhYmVsOiBfX2FkZHJlc3NfXwogICAgcmVnZXg6IChbXjpdKykoPzo6XGQrKT87KFxkKykKICAgIHJlcGxhY2VtZW50OiAkMTokMgogIC0gYWN0aW9uOiBsYWJlbG1hcAogICAgcmVnZXg6IF9fbWV0YV9rdWJlcm5ldGVzX3NlcnZpY2VfbGFiZWxfKC4rKQogIC0gc291cmNlX2xhYmVsczogW19fbWV0YV9rdWJlcm5ldGVzX25hbWVzcGFjZV0KICAgIGFjdGlvbjogcmVwbGFjZQogICAgdGFyZ2V0X2xhYmVsOiBrdWJlcm5ldGVzX25hbWVzcGFjZQogIC0gc291cmNlX2xhYmVsczogW19fbWV0YV9rdWJlcm5ldGVzX3NlcnZpY2VfbmFtZV0KICAgIGFjdGlvbjogcmVwbGFjZQogICAgdGFyZ2V0X2xhYmVsOiBrdWJlcm5ldGVzX25hbWUKICAtIHNvdXJjZV9sYWJlbHM6IFtfX21ldGFfa3ViZXJuZXRlc19wb2RfbmFtZV0KICAgIGFjdGlvbjogcmVwbGFjZQogICAgdGFyZ2V0X2xhYmVsOiBrdWJlcm5ldGVzX3BvZF9uYW1lCg== --- --- prometheus.io/path: /actuator/prometheus prometheus.io/port: '10080' prometheus.io/scrape: 'true'
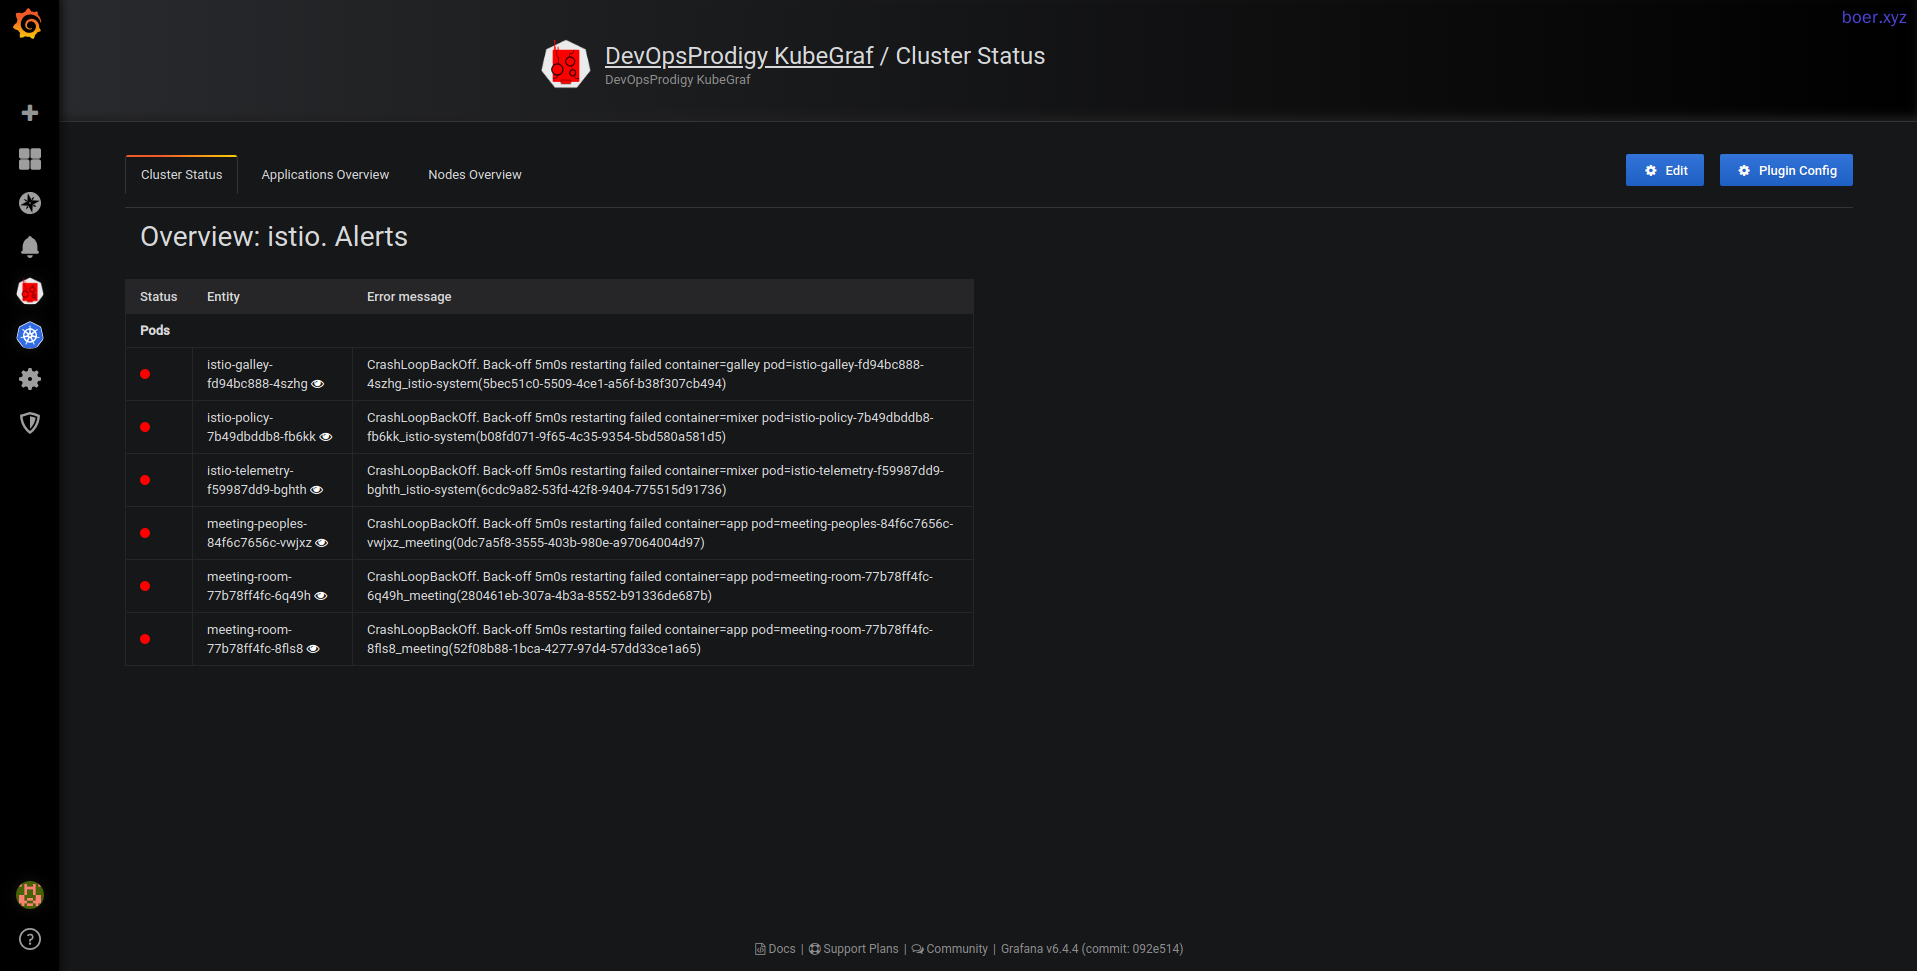
Grafana插件
https://grafana.com/grafana/plugins/devopsprodigy-kubegraf-app
Ref
https://github.com/prometheus-operator/prometheus-operator https://github.com/prometheus-operator/kube-prometheus https://github.com/opsnull/follow-me-install-kubernetes-cluster/blob/master/08-4.kube-prometheus%E6%8F%92%E4%BB%B6.md https://www.qikqiak.com/k8strain/monitor/operator/install/ https://work.weixin.qq.com/api/doc/90000/90135/90236#%E6%96%87%E6%9C%AC%E6%B6%88%E6%81%AF https://github.com/prometheus-operator/prometheus-operator/blob/master/Documentation/additional-scrape-config.md